
Three letters appear on your paycheck, in your broker’s dashboard, and in every quarterly earnings report: YTD. Year to date. It sounds deceptively simple — and it is — but the way it’s used quietly shapes decisions worth billions of dollars every year.
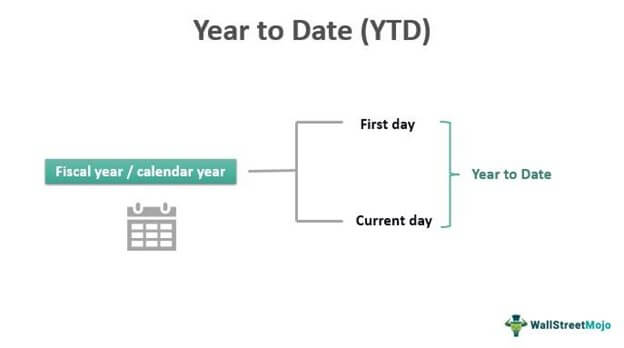
At its core, YTD means the period from the first day of the current year up to today (or some specified date within that same year). Whether you’re a salaried employee checking how much you’ve earned so far, a fund manager comparing portfolio returns, or a CFO tracking whether revenue is on pace, YTD is the measurement that ties a snapshot in time back to where things started.
Calendar year vs. fiscal year: the start date matters
For most individuals, “the year” begins on January 1. That’s the calendar year, and it’s the default assumption when YTD appears without further context.
But companies don’t have to follow the calendar. A fiscal year is any 12-month accounting period a business chooses — and it might start in April, July, or October. Retailers famously end their fiscal years on January 31, after the holiday rush, which means their fiscal year begins February 1.
Calendar YTD
Jan 1 →
Today (or any date in the same calendar year). The default when nothing else is specified.
Fiscal YTD
FY Start →
From a company’s fiscal year start date up to the date given. Could be any month.
Quick rule: If a financial statement says “YTD” with no other qualifier, assume it runs from January 1. If the issuer follows a non-calendar fiscal year, verify the actual start date before drawing conclusions.
Three places you’ll encounter YTD
| Context | What YTD tracks | Why it matters |
| InvestingPortfolio | Return on holdings from Jan 1 to now | Benchmarks performance against indices like the S&P 500 without waiting for year-end |
| BusinessFinancials | Revenue, expenses, profit vs. budget | Flags overspending or under-performance early enough to course-correct |
| PersonalPay stub | Gross and net earnings, tax withheld | Helps with budgeting and confirms withholding ahead of tax season |
How to calculate YTD
Basic formula
To find the percentage change from the start of the year to any later point, four steps are all you need:
- Record the value on the first day of the year (opening value).
- Record the value at the chosen end date (current value).
- Subtract the opening value from the current value, then divide by the opening value.
- Multiply by 100 to express as a percentage.
Annualised YTD
A raw YTD figure of +4% in June isn’t directly comparable to a full-year return of +8%. To put them on equal footing, annualise the YTD figure: divide current value by opening value, raise to the power of (12 ÷ months elapsed), then subtract 1 and multiply by 100.
Interactive calculator
Try it yourself. Adjust the values below to see your YTD return — and its annualised equivalent.
Start value ($)$9,000
Current value ($)$9,500
Months elapsed9 mo
YTD return
5.56%
Annualised
7.48%
YTD vs. MTD: a quick distinction
Month-to-date (MTD) works on the same logic but resets at the start of each calendar month rather than the start of the year. If today is May 20, your MTD sales figure covers May 1–19, while YTD covers January 1–May 19. MTD is useful for spotting short-term blips; YTD shows the bigger arc of the year.
Both MTD and YTD are trailing figures — they describe what has happened, not what will happen. Use them alongside forecasts and benchmarks to get the full picture.
Don’t Miss: Pec Stretch: Why Your Chest is Tighter Than You Think
Why it’s more useful than you might think
An annual report tells you where you ended up. A daily or weekly number is too volatile to act on. YTD occupies the sweet spot: long enough to filter out noise, short enough to still influence the outcome. That’s what makes it the default lens for managers, investors, and payroll departments alike.
Check your YTD figures periodically, compare them to benchmarks and prior years, and you’ll catch problems — or opportunities — while there’s still time in the year to respond.

C168 Rút Tiền Siêu Tốc: Trải Nghiệm Giao Dịch Tài Chính Minh Bạch và Nhanh Chóng
F8bet nơi quy tụ những game show nổi bật nhất năm 2026
F8bet nơi quy tụ những game show nổi bật nhất năm 2026
Mình thấy F8BET có giao diện thân thiện với thiết bị di động, truy cập và sử dụng khá mượt.
Điểm nổi bật của C168 nằm ở kho trò chơi phong phú, từ cá cược thể thao, casino trực tuyến đến các tựa game đổi thưởng hấp dẫn. Bên cạnh đó, hệ thống giao dịch nạp rút nhanh chóng cùng dịch vụ hỗ trợ khách hàng 24/7 giúp người chơi an tâm trong suốt quá trình trải nghiệm.
F8bet nơi quy tụ những game show nổi bật nhất năm 2026
C168: Sân Chơi Cá Cược Thể Thao Đỉnh Cao Dành Cho Người Việt
F8bet nơi quy tụ những game show nổi bật nhất năm 2026
F8BET nơi quy tụ những game show nổi bật nhất năm 2026
78win nơi quy tụ những game show nổi bật nhất năm 2026
Nền tảng cung cấp nhiều sản phẩm hấp dẫn như cá cược thể thao, casino trực tuyến, game slot và các trò chơi đổi thưởng phổ biến.
F8BET nơi quy tụ những game show nổi bật nhất năm 2026
Nếu đang tìm một nền tảng có giao diện hiện đại và dễ sử dụng thì F8BET là cái tên đáng để tham khảo.
Điều mình ấn tượng ở F8BET là giao diện hiện đại và thân thiện với người dùng. Người mới cũng có thể dễ dàng làm quen chỉ sau vài phút sử dụng.
Vừa hoàn tất đăng ký tại C168 là mình nhận ngay được code 68K khởi nghiệp, hỗ trợ khách hàng ở đây trực 24/7 nên giải đáp thắc mắc rất nhanh. Giao diện trang chủ mượt mà, dễ thao tác, cực kỳ phù hợp cho những anh em mới bắt đầu tìm kiếm cơ hội bứt phá thu nhập.
Mình đánh giá cao việc F8BET thường xuyên cập nhật thông tin và cải thiện trải nghiệm người dùng. Điều này giúp quá trình sử dụng thuận tiện hơn.
Khám phá QQ88 – điểm đến lý tưởng dành cho những ai yêu thích nội dung chất lượng và trải nghiệm trực tuyến tiện lợi. Giao diện thân thiện, tốc độ ổn định và luôn đổi mới mỗi ngày.
Mình đánh giá cao cách bài viết phân tích các ưu điểm của F8BET. Thông tin được trình bày mạch lạc và phù hợp với nhu cầu tìm hiểu của nhiều người.
Mình tham gia NEW88 từ đầu năm và đến giờ vẫn khá hài lòng. Nhà cái có nhiều kèo bóng đá hấp dẫn, cập nhật nhanh theo diễn biến trận đấu và đặc biệt là quá trình nạp rút diễn ra rất thuận tiện.
C168 ghi điểm nhờ giao diện trực quan và các quy trình vận hành được niêm yết công khai ngay trên website chính thức C168.com. Hệ thống này giúp người dùng mới dễ dàng tiếp cận lộ trình giải trí minh bạch mà không gặp phải các rào cản phức tạp về mặt kỹ thuật. Tuy nhiên, người chơi cần lưu ý đọc kỹ các điều khoản và luôn tham gia có trách nhiệm để kiểm soát tốt rủi ro tài chính cá nhân.
Nhà cái C168 thu hút đông đảo người chơi nhờ giao diện hiện đại, giao dịch nhanh chóng và hệ thống bảo mật an toàn.
C168 ghi điểm với mình nhờ giao diện hiện đại và các quy trình vận hành được niêm yết công khai cực kỳ minh bạch ngay tại trang chủ. Hệ thống này giúp người dùng dễ dàng nắm bắt thông tin và tham gia giải trí một cách an tâm hơn nhờ lộ trình rõ ràng. Tuy nhiên, anh em nhớ tham gia có trách nhiệm và luôn biết điểm dừng để bảo vệ nguồn vốn cá nhân nhé.
C168 ứng dụng công nghệ mã hóa dữ liệu hiện đại, đảm bảo an toàn tối đa cho thông tin hội viên khi thực hiện các giao dịch tại nhà cái C168. Việc đầu tư mạnh mẽ vào hạ tầng kỹ thuật và tốc độ truy cập cho thấy cam kết của thương hiệu trong việc kiến tạo một môi trường giải trí ổn định. Cảnh báo: Cá cược trực tuyến mang tính may rủi cao, bạn hãy luôn chủ động quản lý nguồn vốn và tham gia tỉnh táo
F8BET là một trong những website có nhiều chuyên mục đa dạng, đáp ứng nhu cầu giải trí của nhiều đối tượng người dùng khác nhau.
C168 là nhà cái trực tuyến uy tín, mang đến hệ sinh thái giải trí đa dạng với cá cược thể thao, casino trực tuyến, slot game và nhiều sản phẩm hấp dẫn khác.
C168 (C168.com) ghi điểm với mình nhờ giao diện hiện đại và các quy trình vận hành được niêm yết công khai cực kỳ minh bạch ngay tại trang chủ. Hệ thống này giúp người dùng dễ dàng nắm bắt thông tin và tham gia giải trí một cách an tâm hơn nhờ lộ trình rõ ràng. Tuy nhiên, anh em nhớ tham gia có trách nhiệm và luôn biết điểm dừng để bảo vệ nguồn vốn cá nhân nhé.
Hệ thống link vào C168 luôn ổn định và không bị chặn, giúp trải nghiệm soi kèo bóng đá hay chơi casino của mình không bao giờ bị gián đoạn. Điểm cộng lớn nhất là nền tảng bảo mật thông tin cực tốt, giúp mình hoàn toàn yên tâm tận hưởng kho game đồ sộ mà không lo ngại rủi ro rò rỉ dữ liệu cá nhân.
C168 không ngừng nâng cấp chất lượng dịch vụ và tăng cường bảo mật cho người dùng. Bên cạnh đó, nhà cái còn thường xuyên triển khai các chương trình ưu đãi hấp dẫn, góp phần nâng cao trải nghiệm giải trí cho thành viên.
Vừa hoàn tất đăng ký tại C168 là mình nhận ngay được code 68K khởi nghiệp, hỗ trợ khách hàng ở đây trực 24/7 nên giải đáp thắc mắc rất nhanh. Giao diện trang chủ mượt mà, dễ thao tác, cực kỳ phù hợp cho những anh em mới bắt đầu tìm kiếm cơ hội bứt phá thu nhập.
C168 là nhà cái trực tuyến nổi bật với hệ sinh thái giải trí đa dạng, đáp ứng nhu cầu của đông đảo người chơi.
C168 không ngừng nâng cấp chất lượng dịch vụ nhằm mang đến trải nghiệm giải trí mượt mà cho người dùng. Hệ thống thanh toán nhanh chóng cùng nhiều chương trình ưu đãi hấp dẫn là những điểm nổi bật của nền tảng này.
Mình mới biết đến F8BET qua bài viết này, thấy giao diện khá trực quan và dễ sử dụng. Cảm ơn tác giả đã chia sẻ thông tin hữu ích.
Hệ thống link vào C168 luôn ổn định và không bị chặn, giúp trải nghiệm soi kèo bóng đá hay chơi casino của mình không bao giờ bị gián đoạn. Điểm cộng lớn nhất là nền tảng bảo mật thông tin cực tốt, giúp mình hoàn toàn yên tâm tận hưởng kho game đồ sộ mà không lo ngại rủi ro rò rỉ dữ liệu cá nhân.
Theo dõi QQ88 để cập nhật nhanh các xu hướng, sự kiện và câu chuyện nổi bật trong nước lẫn quốc tế. Với hệ thống chuyên mục đa dạng cùng nội dung chất lượng, QQ88 mang đến trải nghiệm đọc tin tiện lợi và hữu ích cho mọi độc giả.
Mình mới biết đến F8BET qua bài viết này, thấy giao diện khá dễ sử dụng và các chuyên mục được sắp xếp rõ ràng.
C168 ghi điểm nhờ giao diện trực quan và quy trình vận hành được niêm yết công khai minh bạch ngay trên trang chủ, giúp người chơi dễ dàng nắm bắt thông tin xác thực. Hệ thống xử lý dữ liệu ổn định mang lại cảm giác an tâm khi trải nghiệm các dịch vụ iGaming chuyên nghiệp. Tuy nhiên, anh em lưu ý cần tìm hiểu kỹ điều khoản và luôn tham gia có trách nhiệm để bảo vệ nguồn vốn cá nhân.
Để đảm bảo an toàn thông tin và tránh các rủi ro từ website giả mạo, người chơi nên ưu tiên truy cập qua hệ thống link c168 chính thức đã được xác thực từ nhà cái. Nền tảng này chú trọng kiến tạo môi trường giải trí sòng phẳng, thúc đẩy văn hóa chơi có kiểm soát nhằm hạn chế tối đa rủi ro tài chính cho hội viên. Cảnh báo rủi ro: Cá cược trực tuyến mang tính chất may rủi cao, hãy luôn tỉnh táo và biết điểm dừng đúng lúc.
Hệ thống link vào C168 luôn ổn định và không bị chặn, giúp trải nghiệm soi kèo bóng đá hay chơi casino của mình không bao giờ bị gián đoạn. Điểm cộng lớn nhất là nền tảng bảo mật thông tin cực tốt, giúp mình hoàn toàn yên tâm tận hưởng kho game đồ sộ mà không lo ngại rủi ro rò rỉ dữ liệu cá nhân.
Trước giờ mình cũng từng tìm hiểu khá nhiều nền tảng khác nhau, thấy F8BET có cách bố trí chuyên mục khá rõ ràng nên dễ tìm nội dung cần sử dụng.
C168 là nền tảng giải trí trực tuyến được nhiều người chơi quan tâm nhờ hệ thống cá cược đa dạng và giao diện hiện đại. Tại đây, hội viên có thể tham gia nhiều chuyên mục hấp dẫn như thể thao, casino trực tuyến, slot game, bắn cá và xổ số trên cùng một nền tảng.
Mình vô tình đọc được bài viết này và thấy thông tin về F8BET được tổng hợp khá đầy đủ. Cảm ơn tác giả vì nội dung hữu ích và dễ theo dõi.
Nền tảng c168 thường xuyên triển khai các chương trình ưu đãi dành cho thành viên mới và người chơi lâu năm, góp phần gia tăng trải nghiệm giải trí.
Để đảm bảo an toàn thông tin và tránh các rủi ro từ website giả mạo, người chơi nên ưu tiên truy cập qua hệ thống Link C168 chính thức đã được nhà cái xác thực. Nền tảng này chú trọng kiến tạo môi trường giải trí minh bạch, đồng thời thúc đẩy văn hóa chơi có kiểm soát nhằm hạn chế tối đa các rủi ro tài chính phát sinh ngoài ý muốn. Cảnh báo rủi ro: Cá cược trực tuyến mang tính chất may rủi cao, hãy luôn giữ sự tỉnh táo và biết điểm dừng đúng lúc.
Để đảm bảo an toàn thông tin và tránh các rủi ro từ website giả mạo, người chơi nên ưu tiên truy cập qua hệ thống Link C168 chính thức đã được nhà cái xác thực. Nền tảng này chú trọng kiến tạo môi trường giải trí minh bạch, đồng thời thúc đẩy văn hóa chơi có kiểm soát nhằm hạn chế tối đa các rủi ro tài chính phát sinh ngoài ý muốn. Cảnh báo rủi ro: Cá cược trực tuyến mang tính chất may rủi cao, hãy luôn giữ sự tỉnh táo và biết điểm dừng đúng lúc.
Anh em tân thủ thì nên ghé ngay trang chủ C168 đăng ký tài khoản để nhận mã code 68K khởi nghiệp hoàn toàn miễn phí. Đội ngũ nhân viên hỗ trợ tại nhà cái C168 làm việc cực kỳ chuyên nghiệp, giải đáp thắc mắc 24/7 giúp mình cảm thấy rất an tâm ngay từ những ván cược đầu tiên.
Tìm được đường link vào C168 chính thức không bị chặn giúp trải nghiệm soi kèo và chơi casino của mình luôn ổn định, không bao giờ bị gián đoạn. Hệ thống sảnh cược tại C168.COM cực kỳ đa dạng với tỷ lệ trả thưởng cao, mình đã bứt phá thu nhập thành công và rút tiền tỷ chớp nhoáng tại đây rồi!
Trước đây mình chỉ nghe nhắc đến F8BET, đọc bài này xong thì đã hiểu thêm về nền tảng và các tính năng nổi bật.